Real News by RealNex
Author: Jeffrey D. Fisher Ph.D.
Sam Zell (pictured above) recently stated: “The real estate cycle is nearing its end” (Pensions & Investments, May 1, 2017). We must admit that Sam had great timing when he sold his Equity Office REIT to Blackstone in 2007 which was the peak of the last cycle.
Of course, Sam is also not afraid of real estate recessions. He earned the title “The Grave Dancer” back in the early 90s when he bought properties at steep discounts from their replacement cost during the bottom of that cycle.
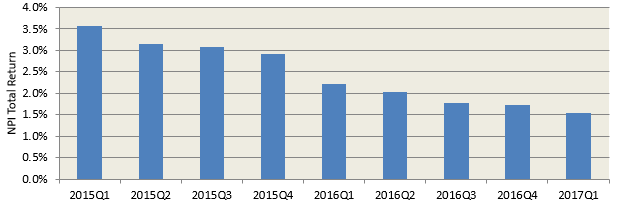
So, what are the facts? Yes, returns have been falling for about 8 consecutive quarters according to the NCREIF Property Index, which includes over a half trillion dollars of real estate around the country managed by the large institutional investors. The first quarter 2017 total return was 1.55 percent, down from 1.73 percent in the fourth quarter 2016 and 2.21 percent a year ago.
Returns for NCREIF Property Index (NPI)
At the same time, the price level has (barely) reached a new high for institutional real estate. (In a previous blog , I showed how the price changes for this index are highly correlated with the price changes we observed over the past 30 years in RealNex data.)
NCREIF Market Value Index (MVI)
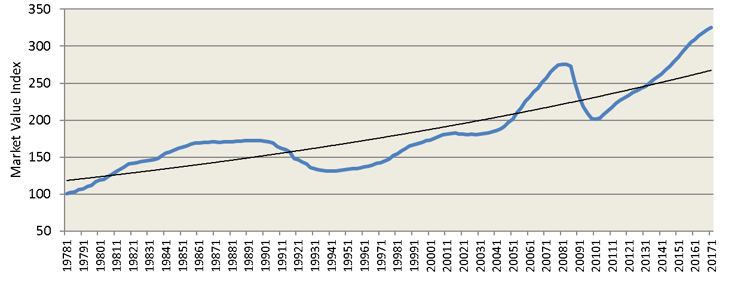
The MVI is a NCREIF measure like a price index that shows value changes among NPI properties with consistent characteristics (i.e. not undergoing significant capex). While only up 1.0% in the first quarter, the MVI increased 5.1 percent over the past year, compared to 8.5 percent over the year ending first quarter 2016. The MVI is now 17.9 percent above its 2008 peak.
The NPI shown above is an unlevered index and low interest rates have provided the opportunity for higher returns by utilizing leverage. For the 3,554 NPI properties utilizing leverage, the leveraged total return was 2.02 percent in the first quarter 2017 and 9.84 percent for the trailing year, comparing more favorably to other asset classes. So, leverage is still favorable although not as much as it was earlier in the cycle.
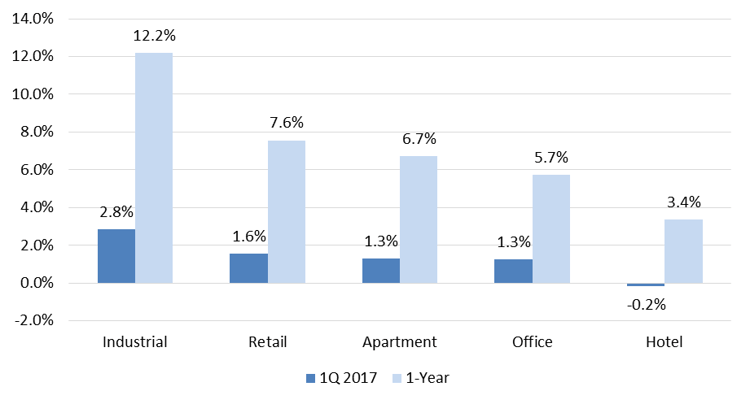
There are noticeable differences in the NPI returns by property type with industrial properties continuing to be the at the lead and hotel trailing the others.
NPI Total Returns by Property Type
Underlying property fundamentals, while resilient in early 2017, also show variance across property types. Occupancy, at 93.0 percent, was flat over the year, although down 20 basis points (bps) from fourth quarter 2016. Apartment was the only property type to see occupancy gains over the quarter, to 93.5 percent; however, this was down 30 bps from one year ago. Over the trailing year, office and industrial had occupancy gains of 70 bps and 20 bps, respectively, while retail occupancy fell by 100 bps. Industrial has the highest occupancy rate, at 95.8 percent.
Net operating income (NOI) growth was 5.8 percent (including hotels) for the trailing year, down from 6.8 percent a year ago, but well above its 3.2 percent long-term average. Industrial holds the lead for annual NOI growth, at 6.8 percent, while apartment and office closely tracked the overall NPI. Retail had 5.2 percent NOI growth over the past year.
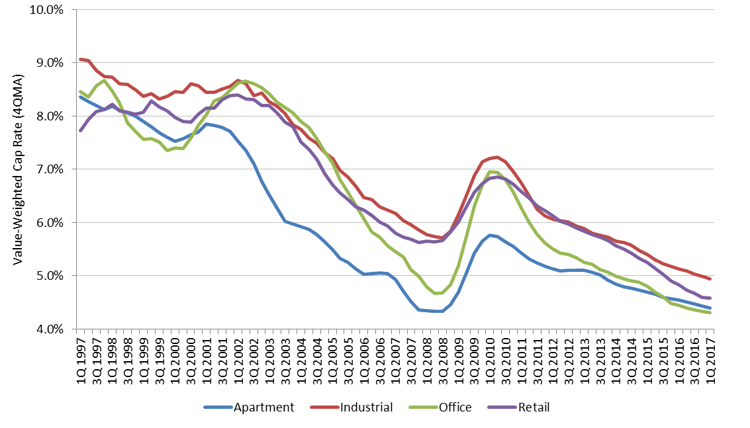
With the market for institutional-quality assets remaining active, the implied valuation cap rate has remained historically low and, at 4.44 percent, was essentially flat over the quarter. However, NPI cap rates were down about 10 bps over the past year. Quarterly cap rate changes were slight, yet varied across property types, ranging from a 10 bps decline for industrial to a 10 bps increase for office.
Despite historically low cap rates for commercial real estate, cap rates spreads to other yields imply relatively fair pricing for the asset class. The NPI cap rate spread to the 10-Year US Treasury was 204 bps in the first quarter, compared to a 259 bps twenty-year average. Similarly, the NPI cap rate spread to the US Corporate BBB bond yield is 75 bps, compared to a 77 bps twenty-year average.
NPI Implied Appraisal Cap Rates by Property Type
The continued downward trend in the NPI total return suggests investor expectations for lower returns ahead but the rent and NOI growth remains strong. There doesn’t appear to be anything on the horizon that would suggest a recession for commercial real estate, as there was as we went into past recessions. But as Sam stated, capital available to invest in real estate is “able to turn on a dime.”
Receive Market Insights
Periodic analysis on rents, pricing, cap rates, and transaction activity across Chicago and key suburban markets.

