
 by
by 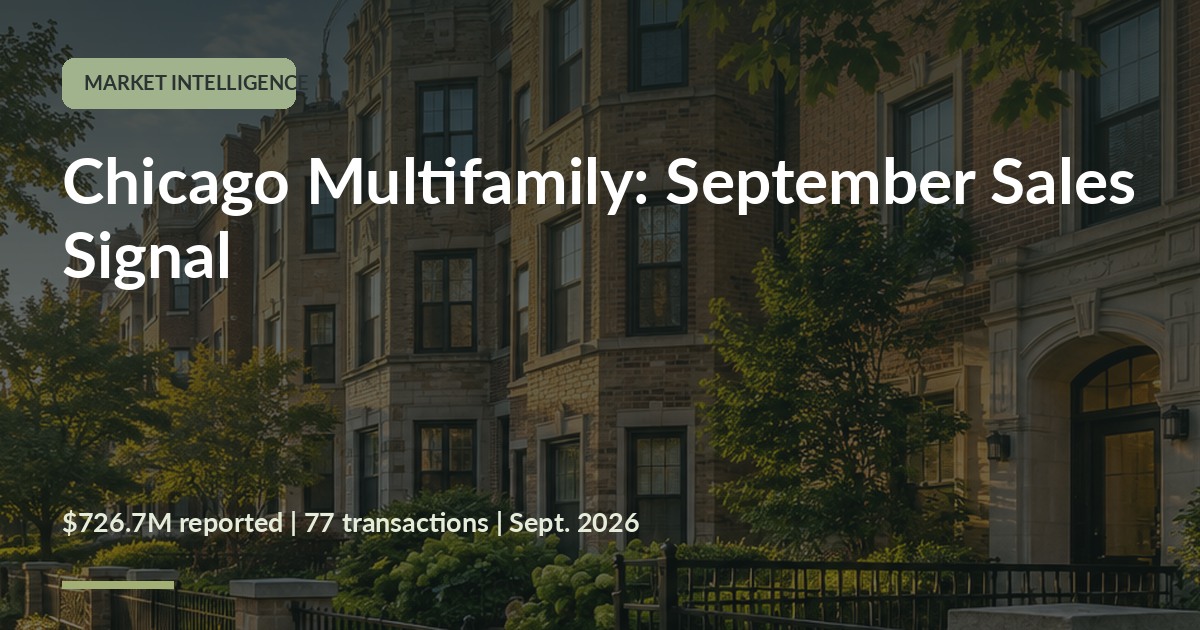
October 11, 2026 | Randolph Taylor, MBA, CCIM | eXp Commercial, National Multifamily Division
Chicago-area apartment sales continued to generate meaningful transaction activity in September. But the headline number is only the starting point for an owner considering a sale, refinancing decision, partnership restructuring, or long-term hold.
A third-party compilation of CoStar transaction information reports $726.7 million in Chicago metropolitan multifamily sales during September 2026, covering 77 transactions and 3,572 units. It reports an average of approximately $203,400 per unit, an average of $209 per square foot, and a $1.84 million median property sale price. Those figures describe the transactions captured in the report—not an automatic pricing benchmark for every apartment building. [1]
For an owner, the question is less “What was the market average?” than “What would qualified buyers pay for this particular property’s income, location, condition and risk?”
1. Sales volume is evidence of activity—not a property-specific valuation
A market can produce significant total dollar volume because several large properties trade, because many smaller buildings sell, or because of a combination of the two. Total volume alone does not reveal how deeply buyers bid on a particular property or whether sellers obtained the prices they initially sought.
September’s 77 transactions provide another data point showing that investment sales have not stopped. Yet the median reported property sale price of $1.84 million is very different from the much larger mean implied by the month’s aggregate dollar volume. That contrast underscores the diversity of the transaction sample. [1]
Owners should be cautious about applying a headline average to a four-unit property, a suburban garden-apartment complex or a large urban asset. Those investments attract different buyers and financing approaches.
2. Chicagoland is not one uniform apartment market
The same September report identifies meaningful dollar volume in several distinct locations: Fulton Market, Far North Suburban Cook, Fox River Valley, Downtown Elmhurst and Evanston. [1] Those markets differ in asset age, property size, tenant profile, financing mix and buyer motivations.
Earlier CoStar Analytics reporting found Chicago apartment sales volume had increased 34% year over year for the 12 months ended June 2026. That supports a broader picture of renewed transaction activity, but does not establish pricing for any one property or submarket. [2]
A downtown institutional transaction can offer useful sentiment information, but it may be a poor direct comparable for a 12-unit or 24-unit suburban building. Local closed sales, unit configuration, actual rents, expenses and physical condition generally deserve more weight.
3. The best buyers look past the asking price
For a smaller or mid-sized multifamily asset, serious buyers typically investigate several layers of value:
- Current income: actual contracted rents, concessions, vacancies and other operating income.
- Operating expenses: taxes, insurance, utilities, repairs, maintenance, management and any expense category requiring normalization.
- Condition and near-term capital needs: roofing, mechanical systems, unit turns and other property-specific risks.
- Rent upside: an evidence-supported distinction between in-place rents and achievable market rents—not an assumption that every unit can reset immediately.
- Financing: debt-service coverage, lender underwriting, required equity and achievable financing terms.
- Comparable transactions: recent properties with similar location, scale, tenancy and physical characteristics.
A strong story about the market cannot substitute for credible property-level financial records. Equally, a property with reliable income, clear capital-expenditure documentation and coherent pricing can distinguish itself even when financial markets are uncertain.
4. Price per unit is a screening tool—not the whole answer
The reported market-wide average of roughly $203,400 per unit can help frame a conversation. It should not be multiplied by an owner’s unit count to declare a price. [1]
For example, two 16-unit buildings can have identical unit counts but substantially different cash flow if one has higher rents, landlord-paid utilities, deferred maintenance or a pending tax reset. The capitalization rate appropriate to each investment may also differ.
Before reaching a pricing conclusion, I prefer to reconcile historical results, current in-place performance, normalized current operations and, separately, a defensible market-stabilized scenario. That makes assumptions explicit and gives prospective buyers a more credible underwriting package.
5. A practical checklist for owners considering a 2026 sale
If September’s transaction activity prompts you to revisit a sale decision, start with five things:
- Assemble a current rent roll and the last twelve months of actual income and expenses.
- Identify the major capital improvements already completed and projects still outstanding.
- Confirm taxes, insurance renewals and significant recurring contracts.
- Review nearby, truly comparable closed transactions—not just asking prices.
- Evaluate the likely buyer pool and debt financing for your specific property type and size.
This preparation serves owners even if they ultimately decide to hold. It clarifies asset performance, supports discussions with lenders and partners, and prevents broad market averages from driving a decision they were never designed to make.
The bottom line
Chicago multifamily investment activity is worth watching. But a strong sales month is not a substitute for property-specific analysis. The decisions that matter to a particular owner still depend on actual NOI, lease structure, condition, geography and buyer financeability.
If you own an apartment property in Chicago or the surrounding suburbs and are evaluating whether to hold, refinance or sell, a confidential, property-specific discussion can clarify the options without relying on a generic metro-wide price-per-unit figure.
Request a confidential multifamily property valuation consultation: https://creconsult.net/chicago-multifamily-property-valuation/
Randolph Taylor, MBA, CCIM | eXp Commercial, National Multifamily Division
Sources and reporting notes
[1] September 2026 Chicago MSA multifamily transaction figures, compiled by a third party from CoStar records. Reporting period: September 1–30, 2026. The aggregate figures have not been independently reconstructed from the underlying transactions by CREConsult.
[2] CoStar Analytics, “Chicago multifamily transaction volume climbs 34% year over year,” June 26, 2026, CoStar market analysis.
The report statistics are attributed external market data, not a broker-produced census or guarantee of completeness; pricing discussion is general market commentary, not an appraisal.